
Single Calibrated Luminance Image
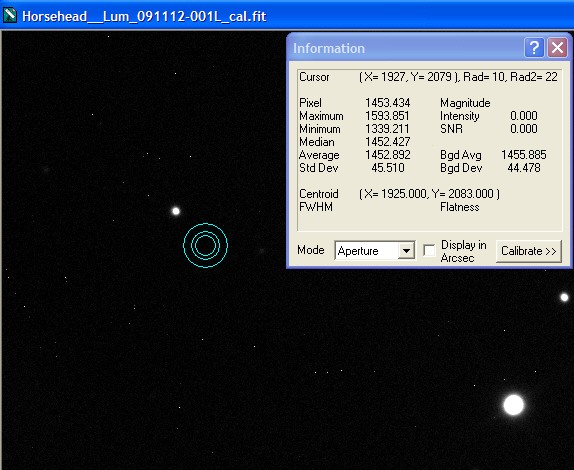
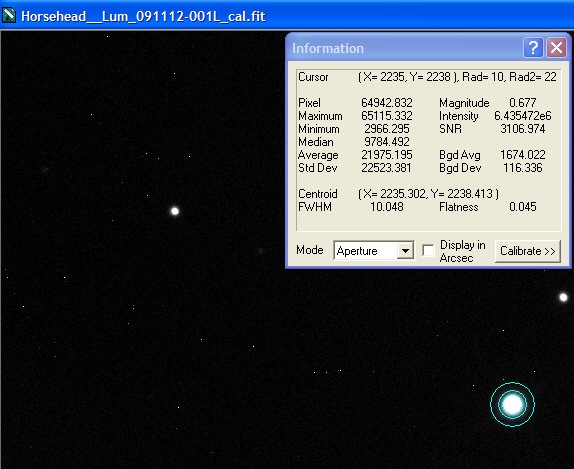
For the time being this illustration is limited to three combine methods (SD Mask, Average, Sum) but further methods such as Median and Sigma Clip may be added later as time permits. The area examined in the screen shots below is from the FITS files used to composite the Horsehead Nebula. This region is in the lower central part of the image, below the Horsehead. The finished image can be seen here. Only the Luminance images are used in this example - 19x 20m exposures were taken, the first of which is used for the single image sample. An RCOS 12.5" f/9 was used with STL-11K.
Please Note: (In view of possible confusion) the images below are not intended to be measured! These are screen shots which are solely to illustrate the measurement taking place. The intention is that you read the measured data by inspecting the Maxim Information panel - for each panel please see where the bullseye is located and inspect the Maxim Information Window to see the data readout for that sample point. There is no table - I leave you to see the results for yourself. Two points were selected in each image:
| The first (left most), to illustrate noise reduction, was taken in one of the darkest, flattest parts of the image. In this case the Standard Deviation reading is the one to inspect. | The second (lower right), to illustrate the effect of photon accumulation on potential saturation / clipping problems, was taken on a nearby 'bright star' (though in reality around Mag 16). In this case the Maximum Pixel is the one to inspect. |
|
|
|
|
|
Single Calibrated Luminance Image |
||
|
|
|
|
|
Stack of 19 Images using SD-Mask Combine Method |
||
|
|
|
|
|
Stack of 19 Images using Average Combine Method |
||
|
|
|
|
|
Stack of 19 Images using SUM Combine Method |
||
Some Analysis
The SD Mask result is interesting and demonstrates why it has become my preferred method: it appears to remove all 'outlier' pixels (excepting static pixels) while giving a Standard Deviation result that is almost as good as the Average method. Even more impressively, it tames star brightness more effectively than any other method (including Average), which means that fewer stars are likely to become saturated in the final result.
The SUM method is also interesting because it appears to demonstrate two things, assuming that a SUM combine of 19x 20m exposures yelds approximately the same result as one long exposure of 6.3 hours:
Firstly, take a look at the 'bright star' that is measured for the SUM method (right-most frame) - it is in reality quite faint. It is not even in the Megastar database and is almost certainly below Mag 15.5 (probably around Mag 16). For this faint star to have achieved a reading of more than 1.2 million counts means that all except the very faintest stars will be saturated beyond redemption. This demonstrates how the 'one long exposure is better' idea can be futile - the whole 6.3 hour exposure would be completely wasted. That represents a whole night of imaging, and since only 3 or 4 nights are obtained (at maximum) from each 1,600 mile astro trip, undertaken at huge effort and expense, only 3 of which are possible per year, I can seriously do without wasting an entire night at the expense of this apparently uncorroborated idea.
Secondly, take a look at the Standard Deviation for the SUM method (left-most frame) - it is more than double that of the single exposure. This appears to show that the noise is accumulating along with the signal, that there is no noise reduction taking place. Is this surprising or is it intuitive? I have always seriously doubted that the mere accumulation of photons over an extended period can achieve the same S/N ratio as the averaging of multiple sets of random data. This (latter) process is a very effective established technique, endorsed by many hundreds of astronomers worldwide, and appears to be demonstrated by the emprirical data above. As far as I can determine the 'one long exposure is better' idea is unsupported by any empirical data - it is apparently just words.
Another apparent fallacy to me is that "read noise must build as each sub exposure is accumulated". This appears counter-intuitive - if it is noise (as must be assumed from the term "read noise") then it too will be reduced by the averaging process. This appears to be supported by the SD Mask and Average combine results above. It also appears to be supported by the results of the SUM method, wherein there is no noise reduction - read noise is added along with the signal.
|
|